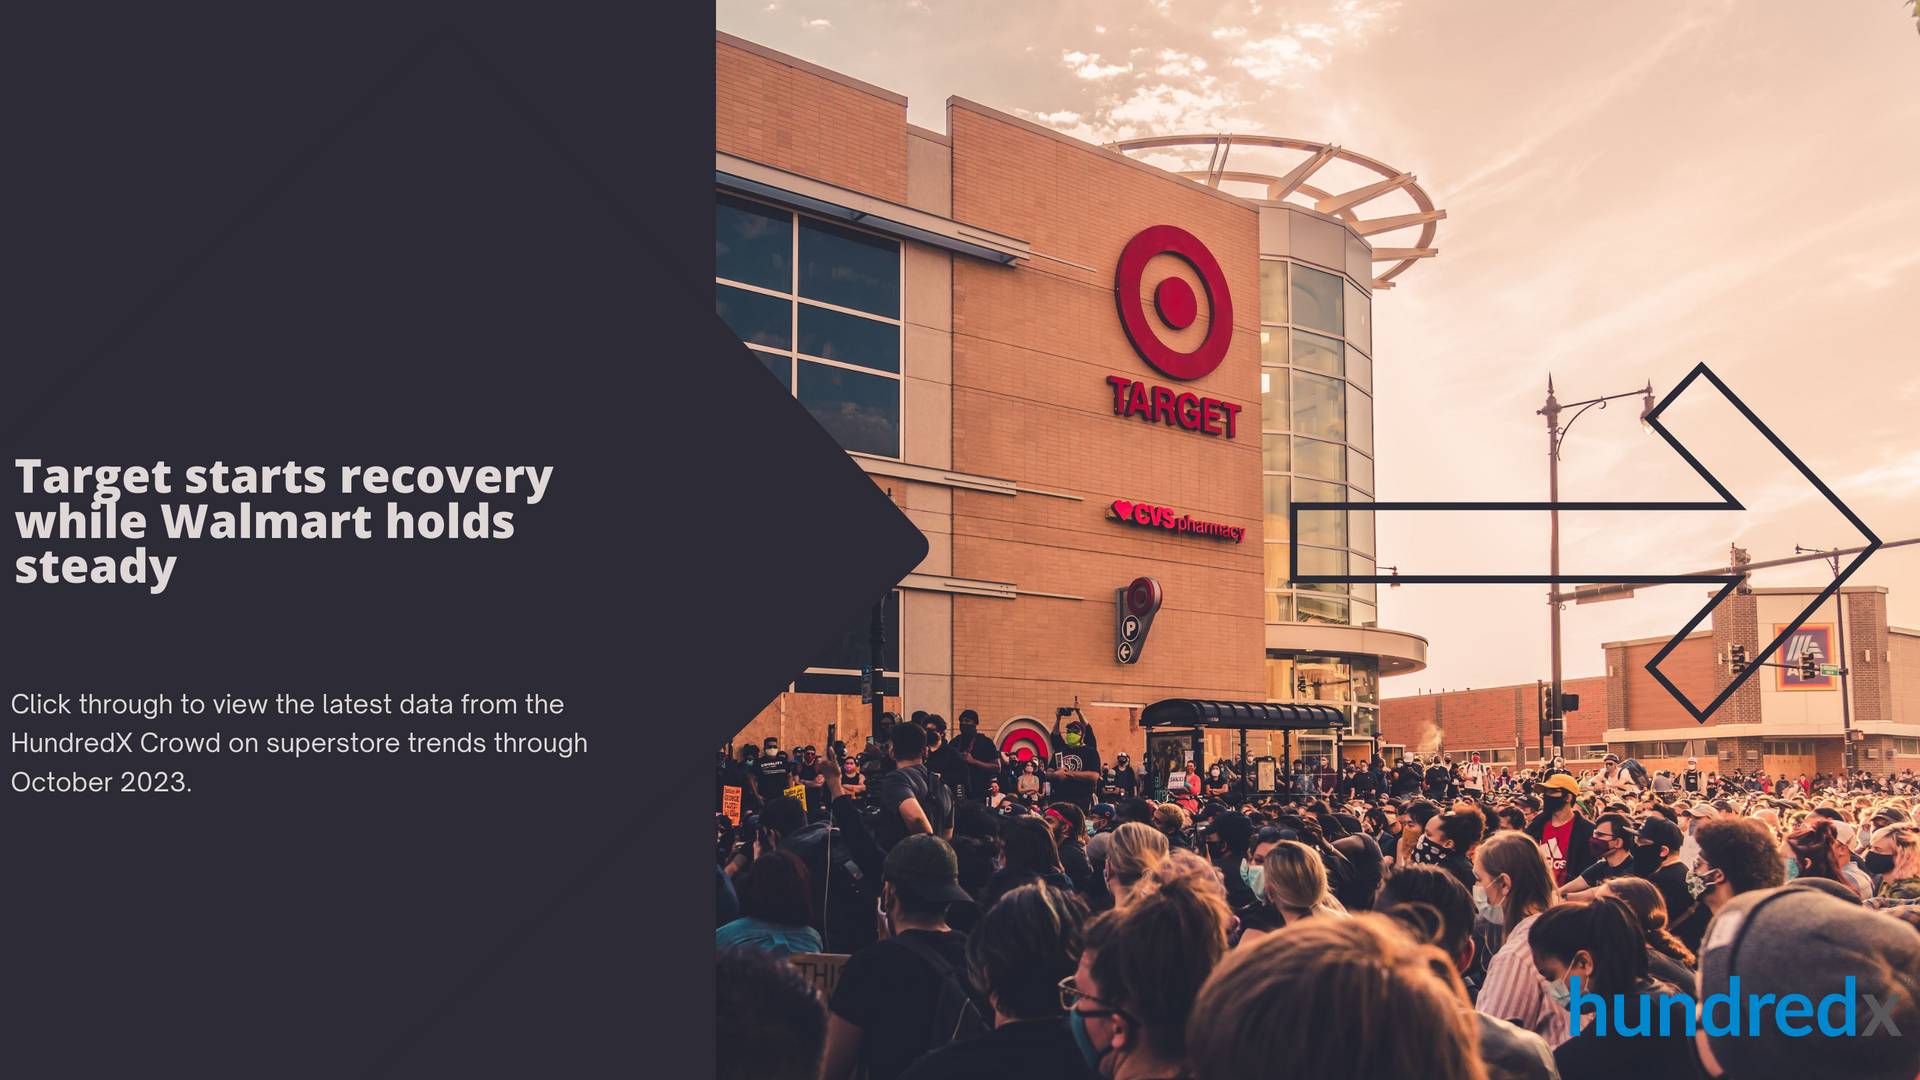
Following a backlash over its Pride Month collection, Target is beginning to show signs of recovery in its growth outlook versus other superstores. This trend is reminiscent of Bud Light's gradual recovery in our data after its marketing controversy.


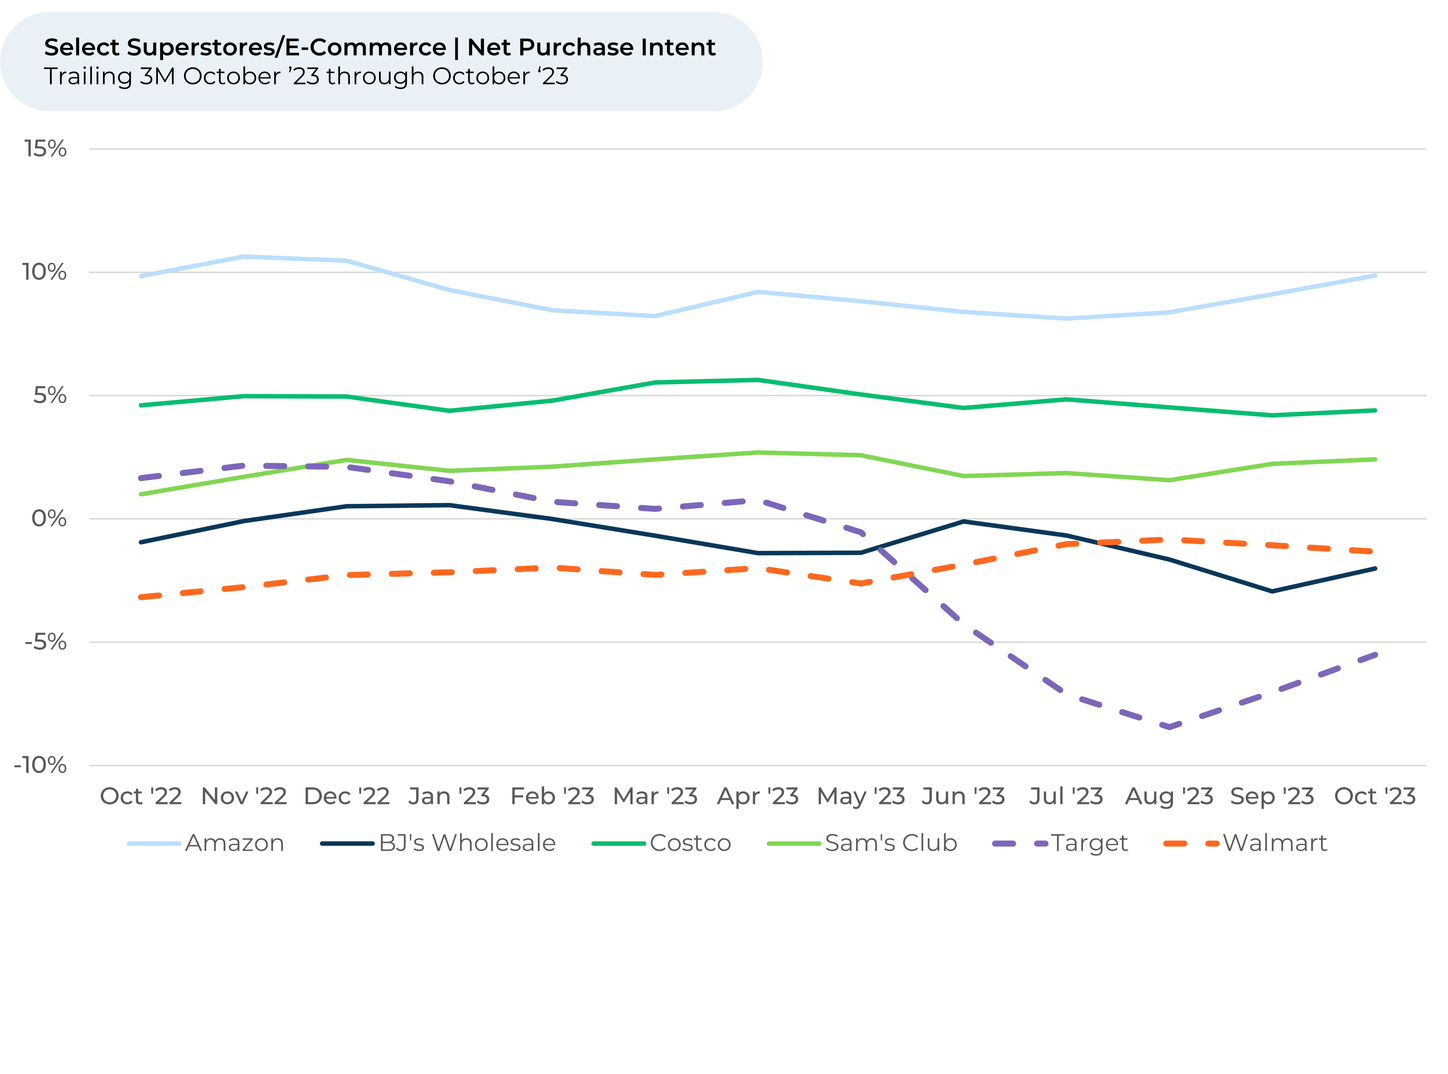
Target experienced a 9% decrease in Purchase Intent1,2 from April through August, but recent data points to a turnaround with a 2% increase through October. On the other hand, Walmart has been relatively unchanged, the same as other superstores BJ’s, Sam’s Club, and Costco.


Examining 155,000 pieces of customer feedback across 8 superstore brands and more than 180,000 pieces of feedback across 62 grocery brands, October 2022 through October 2023, we find:


  • Walmart saw a slight Purchase Intent increase (+1%) during Target’s decline. It’s been holding steady since Target’s recovery.
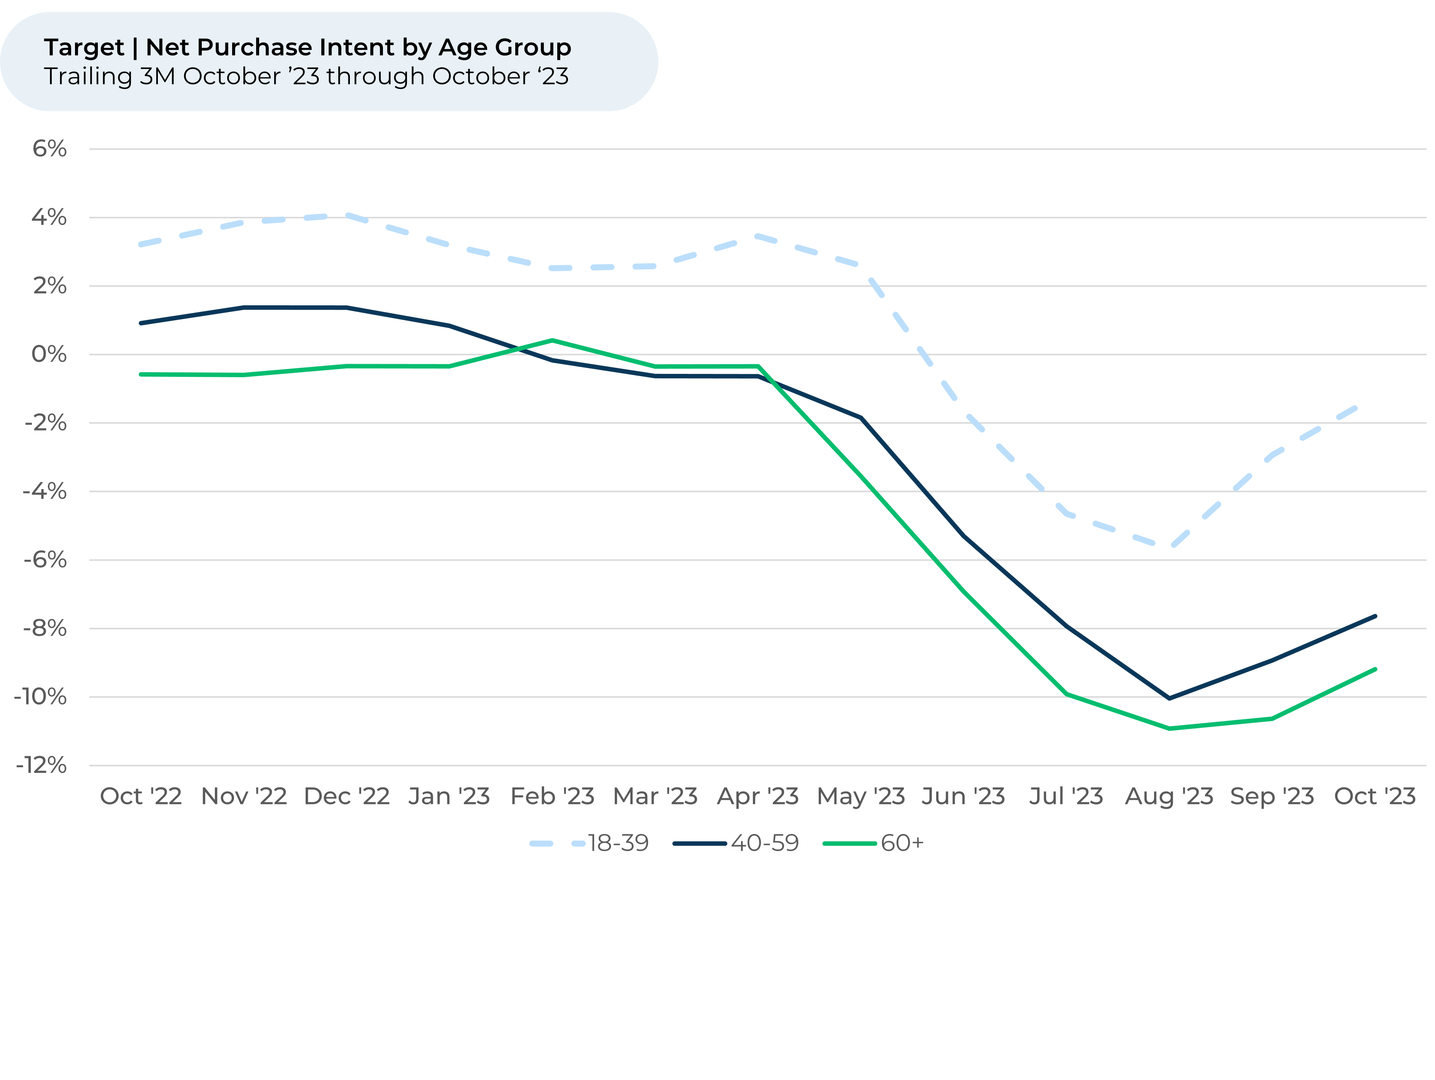
  • Gen-Z and Millennials are driving Target’s recovery; Purchase Intent among this age group rebounded 4% since August compared to the 2% by older generations.
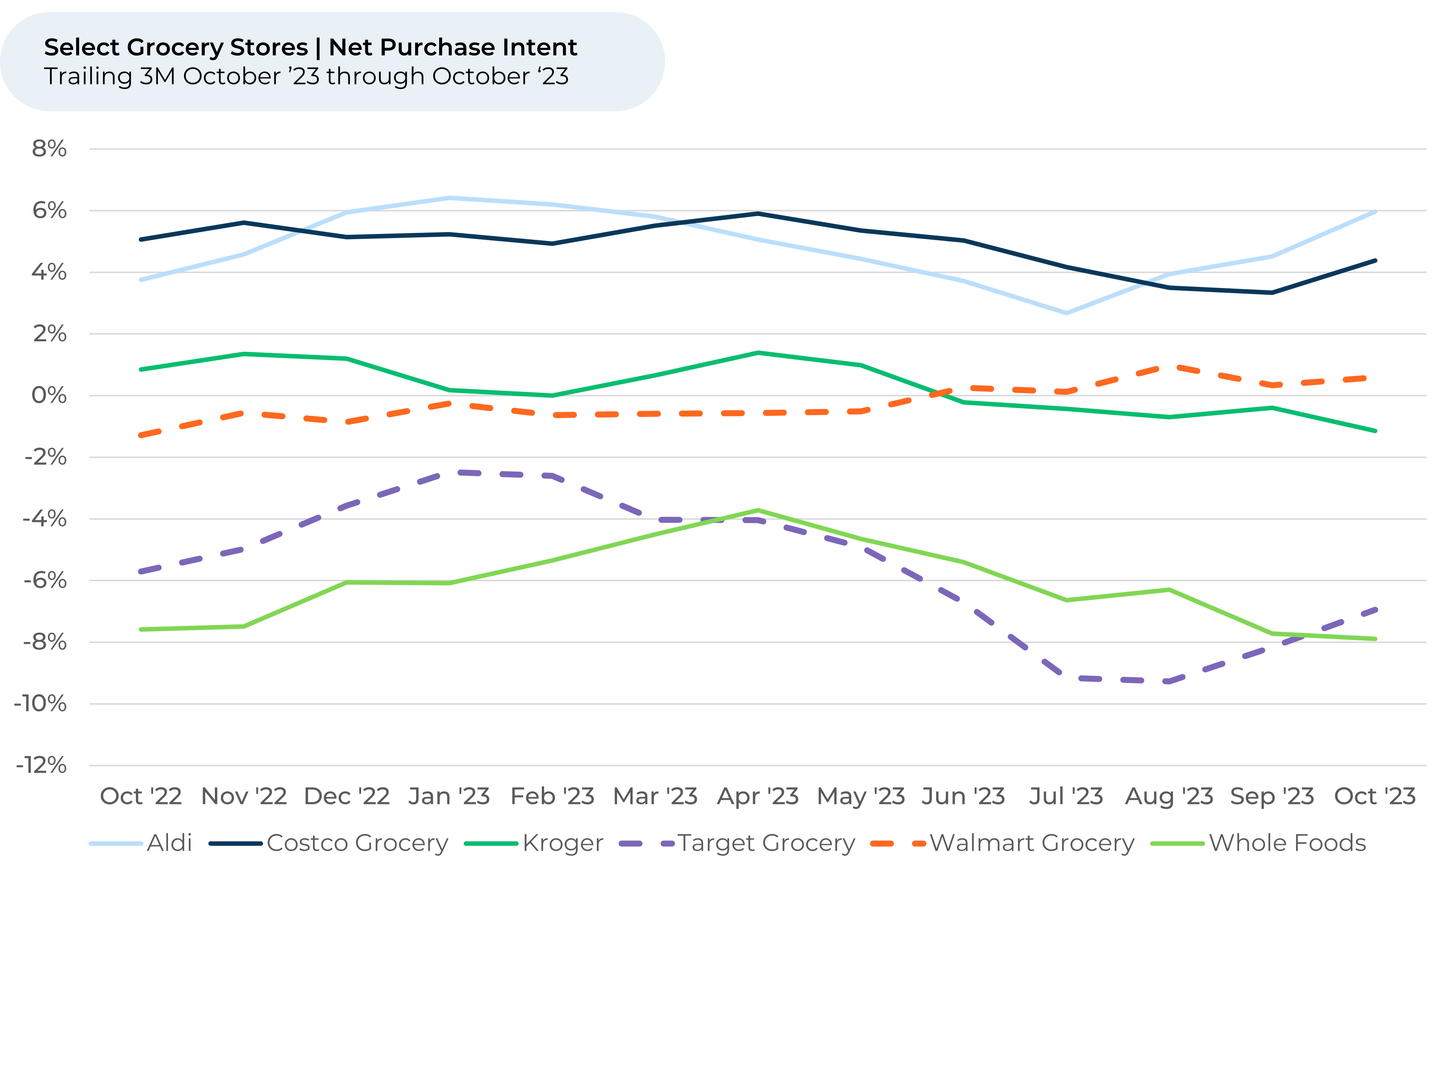
  • Target’s grocery business is also showing signs of Purchase Intent improvement, while Whole Foods has been declining since April.
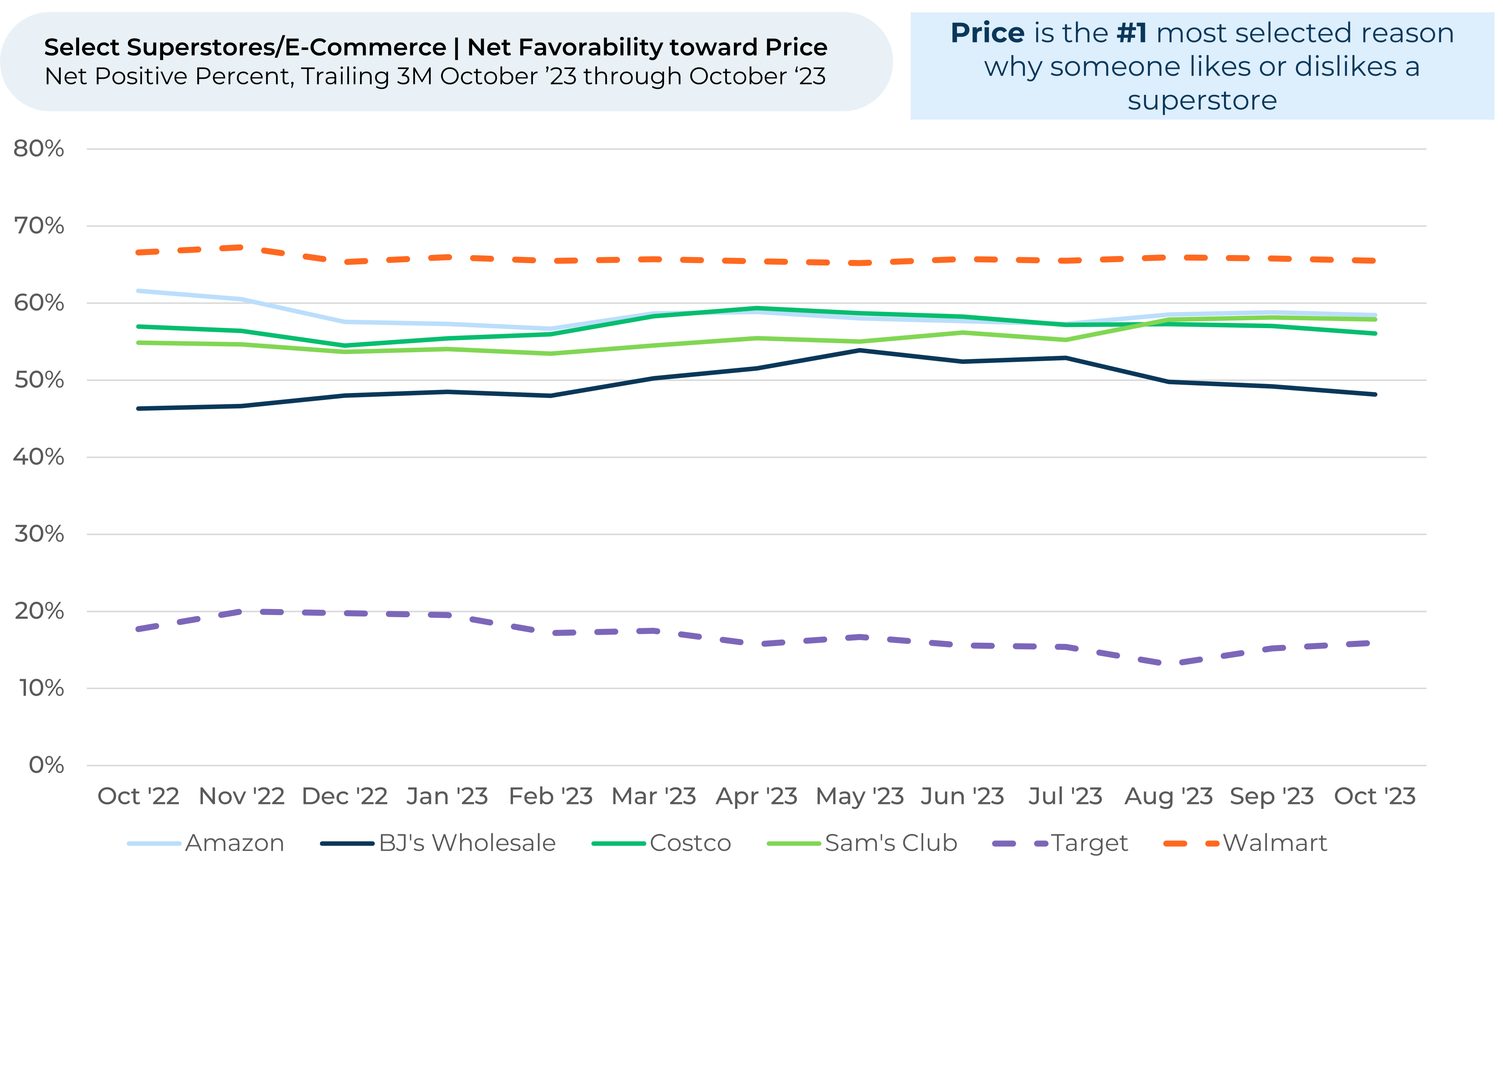
  • While customers view Target’s prices less favorably than competing stores, they are slowly warming to its prices. Price favorability3 rose 3% for Target since August, reflecting credit from customers for price cuts, while Walmart fell 1%.
  • Slide title

    Write your caption here
    Button
  • Slide title

    Target Purchase Intent fell 9% April through August after the brand suffered backlash for its Pride Month collection. Since August, however, Purchase Intent has started climbing back, gaining 2% through October. Purchase Intent for Walmart, which gained slightly during Target’s decline, remains stable.

    Button
  • Slide title

    Target Purchase Intent fell less for Gen-Z and Millennial (-9.1%) customers than it did for middle-aged (-9.4%) and older (-11%) ones. It’s also recovering faster for Gen-Z and Millennial customers (up 4% since August) than older generations (+2%).

    Button
  • Slide title

    Purchase Intent is also recovering for Target’s grocery business – up 2% since August – though it is still down more than some of its biggest competitors this year. The jump comes as Whole Foods (owned by Amazon) has sunk 2% since August and 4% since April.

    Button
  • Slide title

    Target still lags heavily behind its competitors on price – a key area for customers. Customers’ perception of Target’s prices did improve slightly since August (+3%), however, while remaining stable or falling for its competitors. Notably, Walmart dipped 1%. 

    Button

Please contact our team for a deeper look at HundredX's superstore data, which includes more than 320,000 pieces of customer feedback across over 8 companies within the sector, including over 100,000 on each Walmart and Target.


  1. All metrics presented, including Net Purchase Intent (Purchase Intent) and Net Positive Percent / Favorability, are presented on a trailing three-month basis unless otherwise noted.
  2. Purchase Intent represents the percentage of customers who expect to spend more with that company over the next 12 months, minus those who intend to spend less. We find businesses that see Purchase Intent trends gain versus the industry or peers have often seen revenue growth rates, margins, and/or market share also improve versus peers.
  3. HundredX measures Net Favorability towards a driver of customer satisfaction as Net Positive Percent (NPP), which is the percentage of customers who view a factor as a positive (reason they liked the products, people, or experiences) minus the percentage who see the same factor as a negative

Strategy Made Smarter


HundredX works with a variety of companies and their investors to answer some of the most important strategy questions in business:

  • Where are customers "migrating"?
  • What are they saying they will use more of in the next 12 months?
  • What are the key drivers of their purchase decisions and financial outcomes?


Current clients see immediate benefits across multiple areas including strategy, finance, operations, pricing, investing, and marketing.


Our insights enable business leaders to define and identify specific drivers and decisions enabling them to grow their market share.


Please contact our team to learn more about which businesses across 75 industries are best positioned with customers and the decisions you can make to grow your brand’s market share.

####


HundredX is a mission-based data and insights provider. HundredX does not make investment recommendations. However, we believe in the wisdom of the crowd to inform the outlook for businesses and industries. For more info on specific drivers of customer satisfaction, other companies within 75+ other industries we cover, or if you'd like to learn more about using Data for Good, please reach out: https://hundredx.com/contact.

Share This Article

06 May, 2024
Sure, lattes, mochaccinos, and cappuccinos are pricey, but they taste delicious. For many consumers, the great taste of coffee shop coffee made it worth the cost. But customers at Starbucks aren't so sure the tradeoff is worth it anymore. Examining more than 420,000 pieces of feedback across the Quick, Fast, Casual (QFC) industry, including over 21,000 on Starbucks, we find: Starbuck's Purchase Intent 1,2 is down 3% over the past six months, with most of that dip occurring over the past few months. By contrast, Dunkin' Donuts has remained within a tight range over the past six months, as did an average of other, smaller coffee chains. Customers increasingly see less value in Starbucks. Starbuck's Value perception 3 fell 5% over the past six months, compared to just 1% for Dunkin' Donuts. However, it also fell 5% for the average of the smaller coffee chains. Coffee drinkers feel significantly unhappier about Starbuck's quality and taste. Starbuck's Taste perception fell 4% over the past six months, while rising 1% for competitors. Likewise, its Quality perception dipped 3% over the same time period (and 8% over the year). Ultimately, Starbuck's perceived drop in taste is leading inflation-weary consumers to say they plan to spend less at the coffee chain, as the value just isn't as good.
06 May, 2024
Forbes Best Brands for Social Impact, Powered by HundredX
06 May, 2024
Ozempic once dominated the headlines, but GLP-1 competitor Mounjaro is winning over customers. GLP-1 drugs, used for treating diabetes and aiding in weight loss, are relatively new on the market yet have surged in popularity over the last year. They're becoming so popular that J.P. Morgan estimates that 30 million people in the US may be using a GLP-1 drug by 2030. This statistic presents a significant potential for early drug creator Novo Nordisk (Ozempic, Wegovy), and perhaps an even bigger one for Eli Lilly (Mounjaro, Zepbound). HundredX data indicates Eli Lilly is in a position to win over Novo Nordisk as Mounjaro's Usage Intent widens against the competition. Ozempic may have name recognition, but customers feel more positively about Mounjaro's effectiveness and lifestyle impact, even if they aren't excited about its high price. Examining 1,500 pieces of customer feedback across Mounjaro, Ozempic, and Wegovy, we find: GLP-1 users increasingly say they plan to use Mounjaro more, and Ozempic less . Mounjaro’s Usage Intent is up 19% since July, Wegovy’s is up 3%, and Ozempic has stayed within a tight range. Customers feel Mounjaro is more effective than competing drugs, but it’s harder to get . Mounjaro outperforms other GLP-1 drugs in effectiveness, lifestyle impact, and side effects. However, customers dislike its cost and availably more than competitors. GLP-1 users may be more likely to turn away from fast food and the gym. Compared to average HundredX respondents, the average GLP-1 customer says they are more likely to purchase less from QFC restaurants and food delivery services as well as use gyms and weight loss programs less.
Share by: